 Forms a Triangle Pattern: What’s Next?")
MATIC is the native cryptocurrency of Polygon. It is a layer two or scaling solution of the Ethereum ecosystem. It is used to pay fees, governance, or staking on the network. In early 2021, MATIC rebranded itself as Polygon. It creates a fast parallel blockchain that links the main Ethereum blockchain. It uses Proof-of-Stake consensus to make the system more secure and fast.
On the network, validators verify new transactions. It is a duty of running full-time nodes. If it works maliciously, it may result in loss of staked MATIC. On the other hand, the delegator stake the MATIC with a trusted validator. Indeed, it requires research and deep studies before participating or investing in Polygon.
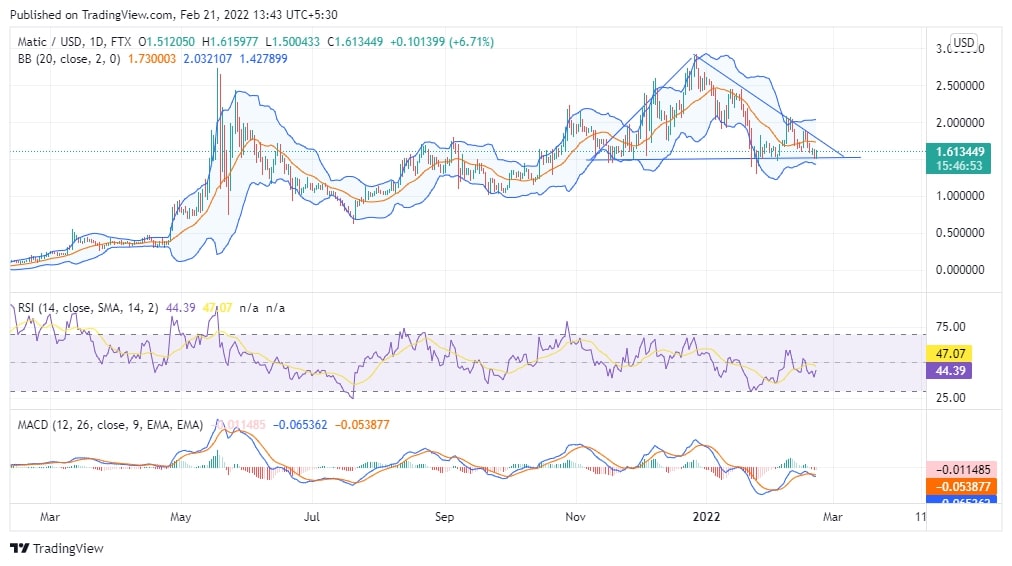
While writing this analysis, the price of MATIC is trading around $1.61. It has a strong support level of around $1.50, and it consolidated around that level many times. We think it is time for a weekly consolidation. Interestingly, it has formed a triangle pattern in the last four months. After forming many higher highs in November and December, it has been in a downtrend in the last two months. We think it will continue till April or May. After breaking this triangle pattern, it may rise to form new higher highs and higher lows. However, you need to wait for a couple of months now. Moreover, click here to know more about the future potential of Polygon cryptocurrency for the upcoming years.
On the daily chart, the MACD is neutral, and RSI is around 44. The candlesticks are forming in the lower half of the Bollinger Bands, which suggests short-term bearishness. The MATIC price will consolidate for the next one or two months.
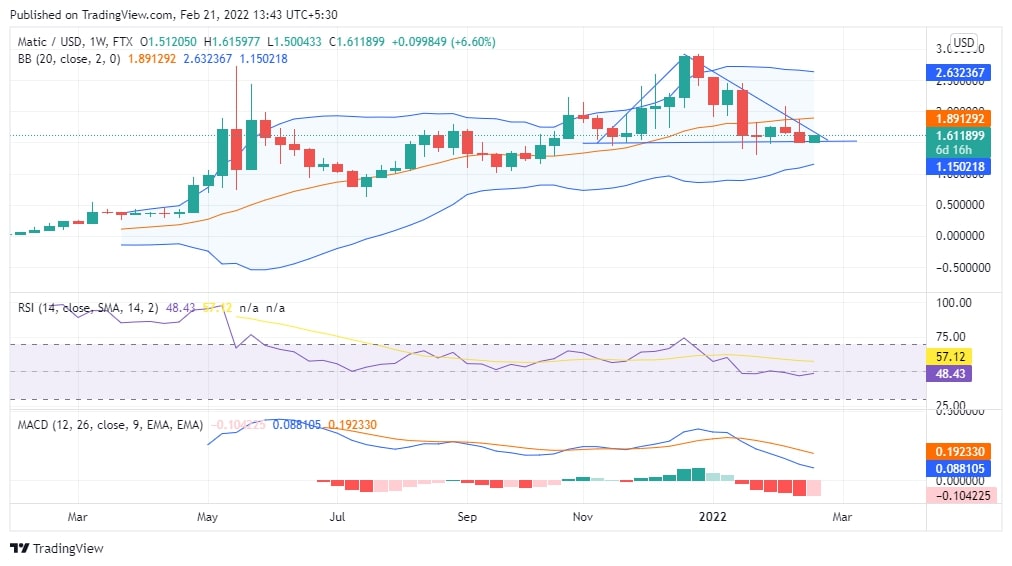
On the weekly chart, the situation is different. Unlike the daily chart, the candlesticks are consolidating, which is not in a downtrend. We do not know if it will break this support level or not but analyzing the indicators, we think it will again form higher highs this year.
All indicators suggest a consolidation phase, not a bearish momentum. After providing a huge return, it has been consolidating and forcing its investors to wait for a couple of months before making another bull run.
We do not think it is the right time to invest until it breaks the triangle pattern. Please wait for a couple of more months and check if the price breaks the resistance or support level. If it breaks the support level, the next support level can be around $1.20, and if it rises, the target will be $3.25. However, if you want a long-term investment, then you should start investing now. The price may change very quickly; please keep an eye on the chart and follow our website for more updates.
Leave a Reply